
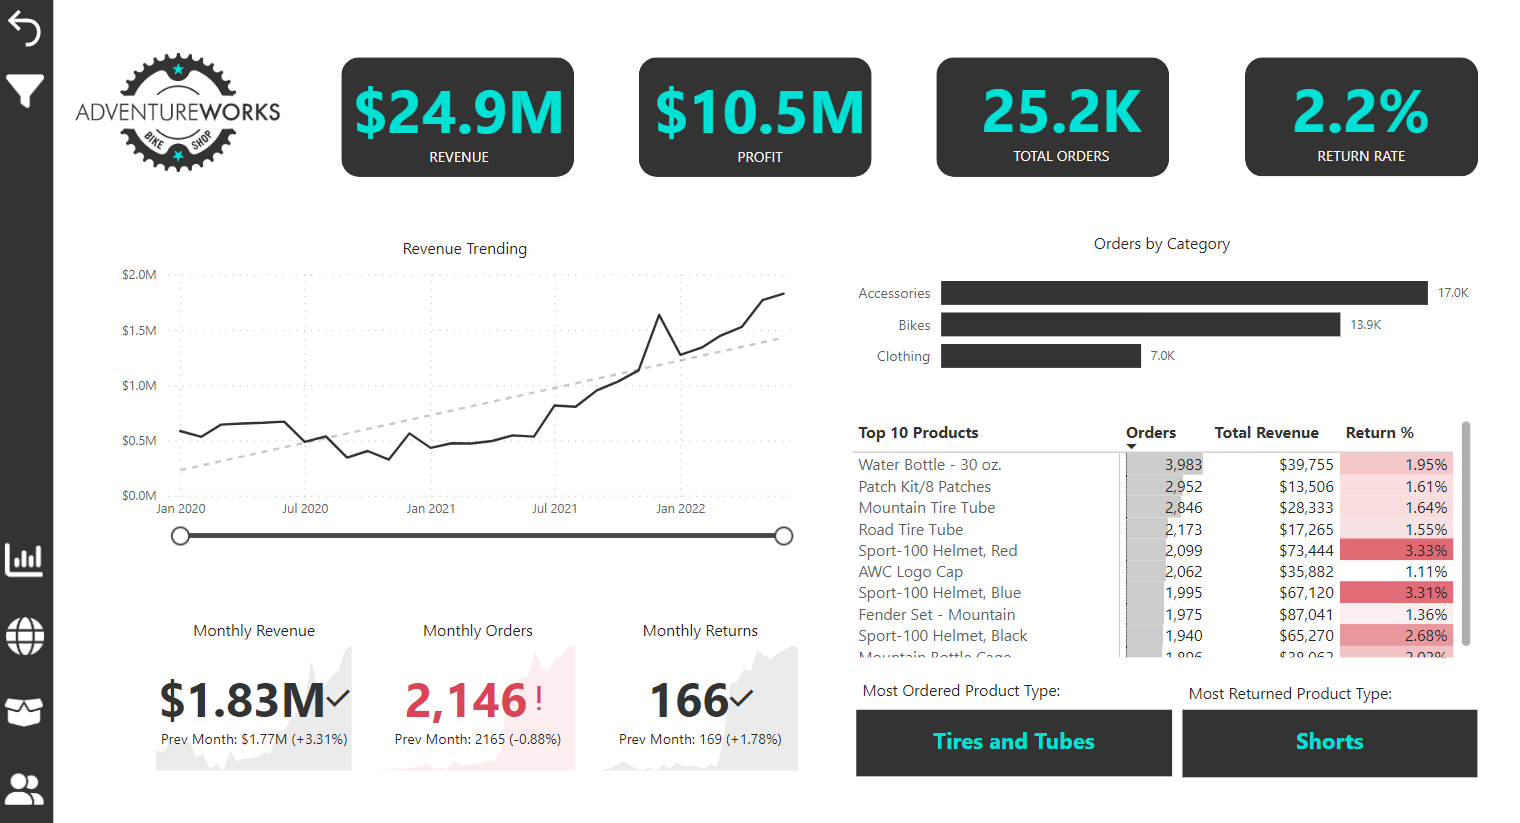
Bicycle Intelligence
Power BI | DAX
Multi-page Power BI dashboard employing slicer panels, maps, drillthrough filters, and custom navigation buttons
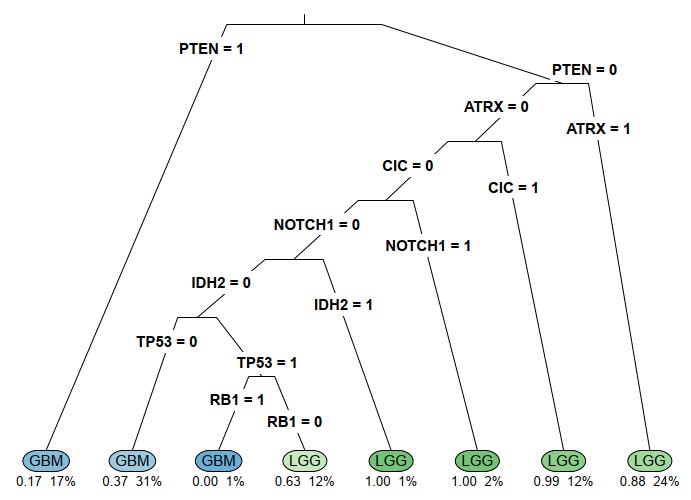
Tumor Predictions
rmarkdown | Bagging | Random Forest | Boosting
Four Machine Learning classification algorithms were built and compared in their ability to predict the Grade of gliomas based on the presence or absence of mutations in 15 Genes.
Manufacturing Analysis
Python | Seaborn | Matplotlib
Using Python to investigate an incidident at a Flotation Plant

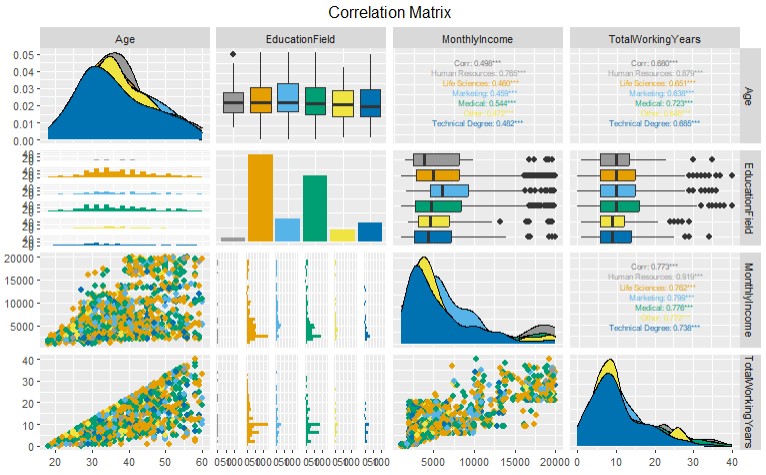
People Analytics
R Studio
Statistical analysis of HR attrition data in R Studio investigating claims of ageism at a leading tech firm.
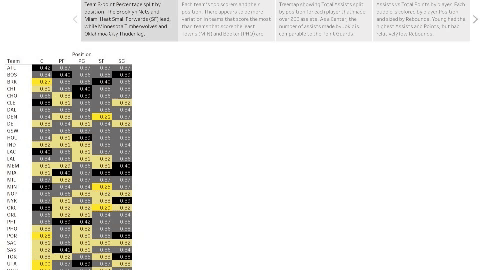
NBA Stats
Tableau Story
Created a Story in Tableau Public analyzing team and player performance for the '21-'22 NBA season.
Healthcare Analysis
SQL
This is a SQL Analysis of 10yrs of hostpital data on diabetic patient encounters from the UC Irvine Machine Learning Repository. I used various SQL Functions, Statements, and Clauses in MySQL Workbench to find data regarding laboratory results and patient re-admissions from two tables with both patient encounter and patient demographic data.
.gif)
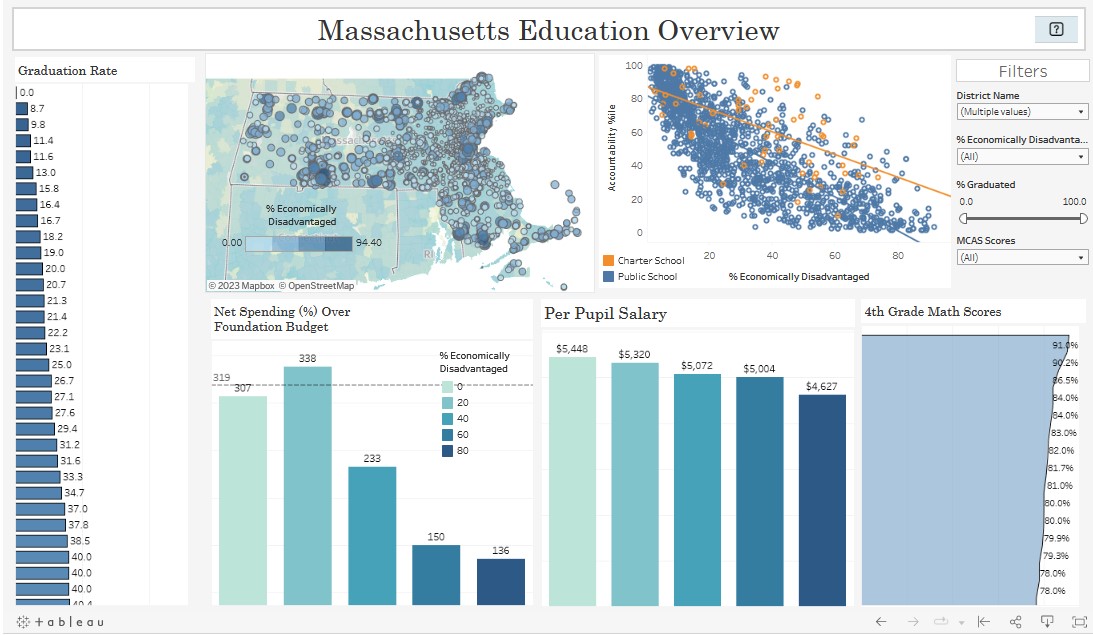
State of Education
Tableau Dashboard
Created an interactive dashboard on Tableau Public using data from the Massachusetts Department of Education on school performance and district budgets.
Food Delivery Project
Excel
Here, I analyzed a food delivery dataset from Kaggle to analyze trends based on customer demographics.
Movielens Project
RStudio | rmarkdown | Regression
In 2006, Netflix launched a competition to improve upon their in-house movie recommender software. This project used a 10-million-row subset of movie ratings data called MovieLens to create a Machine Learning algorithm using some of the methods employed by the winners of that competition.
